
Key Takeaways
St. Charles Airbnb income potential: Market-wide average daily rate is $216.50 with 61% occupancy across 321 active listings — earning an average of $30,100 per year in gross revenue per listing (AirDNA, May 2026). The market scores 98/100 on AirDNA’s Market Score, making it one of the strongest suburban STR markets in the Midwest. A well-managed 2–3 bedroom property can realistically net $17,500–$35,000 annually after operating costs; a 4+ bedroom or premium historic-district property can clear $35,000–$63,000+, but only if you can secure one of the limited permitted addresses or operate in a commercially-zoned location.
St. Charles sits at a rare intersection for short-term rental investors: strong and growing demand, meaningfully constrained supply, and a Main Street historic district that commands ADR premiums 20–25% above the surrounding suburbs. But the numbers alone do not tell the full story — St. Charles also has one of the tightest regulatory environments in the St. Louis metro, with a hard 48-unit residential STR cap that is already full.
This guide breaks down real market data for the St. Charles metro — St. Charles City, St. Peters, O’Fallon, Lake Saint Louis, and Wentzville — covering what properties actually earn, how income varies by property type and season, what your operating costs will look like, and what the regulatory landscape means for new operators in 2026.
We manage short-term rental properties across the St. Charles metro and publish this data because transparent market information helps owners make better decisions — whether they work with us or manage on their own.
Current St. Charles Airbnb Market Data
Market Overview
AirDNA’s MarketMinder tracks 321 active short-term rental listings in St. Charles City as of May 2026, with performance metrics that place the market well above both the broader St. Louis metro and national suburban averages:
- Average daily rate (ADR): $216.50 (+3% year over year)
- Occupancy: 61% (+4% year over year)
- Annual revenue per listing: $30,100
- RevPAR: $120.60 (+6% year over year)
- AirDNA Market Score: 98/100 (“Great”) — Investability 91, Rental Demand 88, Revenue Growth 84, Seasonality 79, Regulation 70
The listing mix is predominantly entire-home rentals (89%), with 56% of properties listed on both Airbnb and Vrbo, 42% on Airbnb only, and 2% on Vrbo only. The bedroom distribution skews toward the middle: 1-bedroom units account for 27% of listings, 2-bedroom 31%, 3-bedroom 21%, 4-bedroom 16%, and 5+ bedroom 5%.
How the Five Submarkets Compare
The St. Charles metro is not a single market — it is five distinct jurisdictions with meaningfully different performance profiles. St. Charles City’s historic Main Street corridor carries a clear ADR premium, while the surrounding suburbs trade lower rates for stronger midweek corporate demand.
| Submarket | Active Listings | ADR | Occupancy | Annual Revenue/Listing | RevPAR |
|---|---|---|---|---|---|
| St. Charles City | 321 | $216.50 | 61% | $30,100 | $120.60 |
| St. Peters | 55 | $177.50 | 65% | $25,500 | $116.70 |
| O’Fallon | 63 | $178.40 | 56% | $23,300 | $101.00 |
| Wentzville | 40 | $171.80 | 58% | $20,700 | $92.60 |
| Lake Saint Louis | — | — | — | — | — |
Lake Saint Louis does not have a standalone AirDNA market page; listings there are absorbed into the Wentzville or O’Fallon data sets. If you own property in Lake Saint Louis, the Wentzville/O’Fallon figures above are the best available proxy.
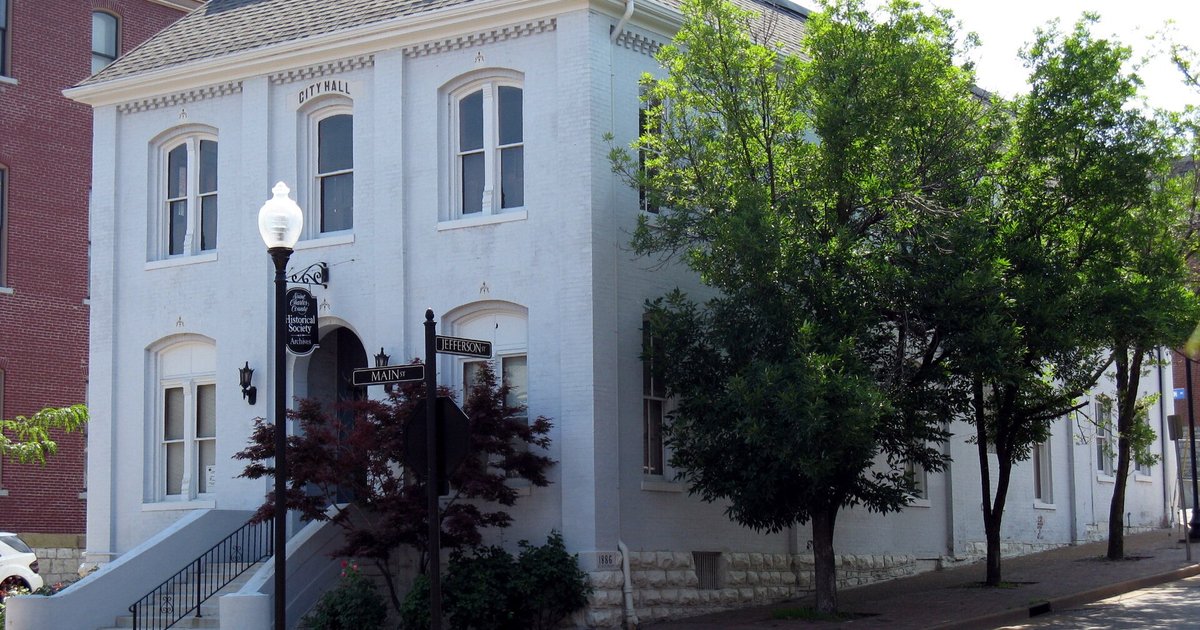
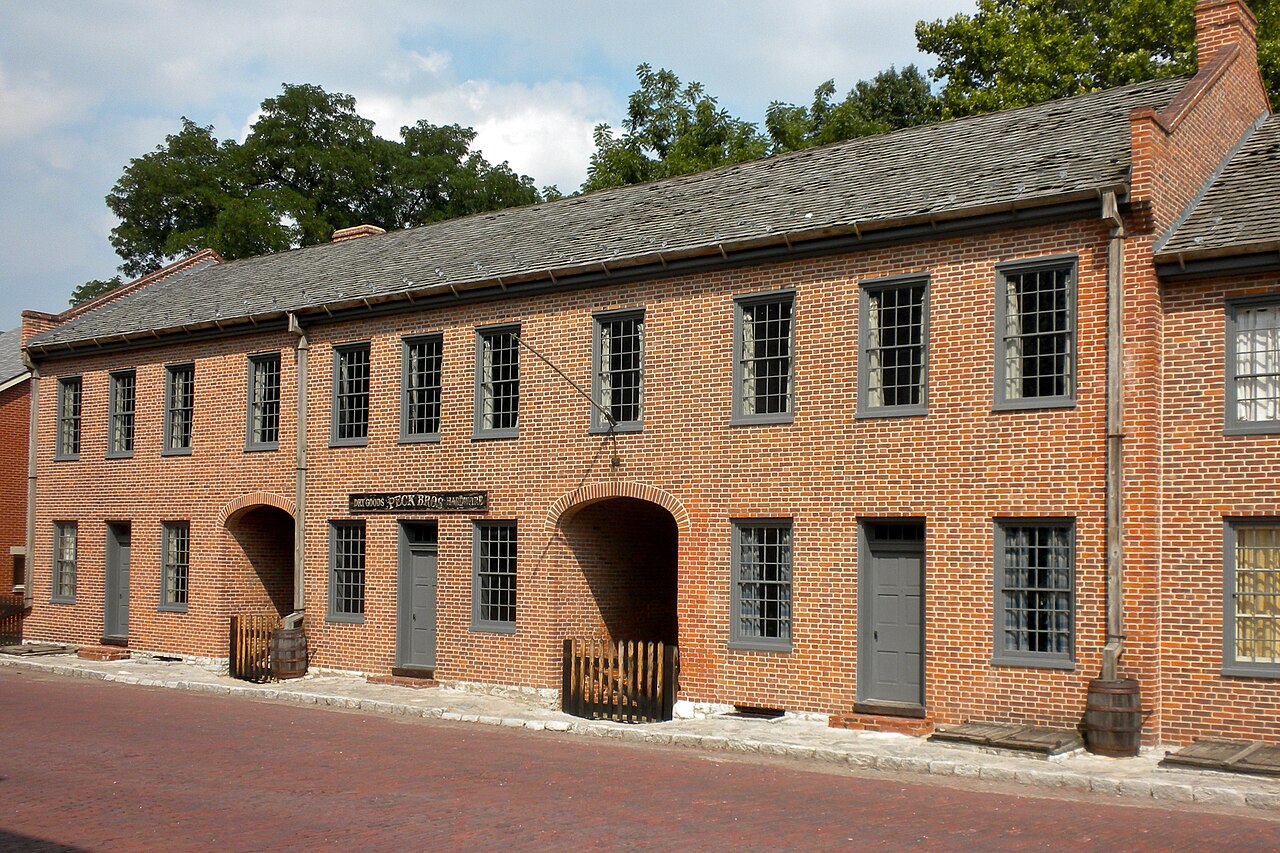
What drives the St. Charles City premium: the walkable historic Main Street corridor — 10 blocks, 100+ shops and restaurants, multiple wedding venues — plus the Ameristar Casino Resort Spa (which draws over 5.5 million visitors annually) create concentrated demand that the suburbs do not replicate. St. Peters’ higher occupancy rate (65% vs. 61%) reflects stronger midweek corporate bookings from nearby employers like Citi and Mastercard, but the lower ADR means net annual revenue still trails St. Charles City.
Estimated Annual Income by Property Type
Using AirDNA’s $30,100 market average as the anchor and cross-referencing publicly visible Airbnb listings across the metro, here are realistic annual income expectations by property type:
| Property Type | Typical Nightly Rate | Expected Occupancy | Est. Gross Revenue | Est. Net (after ~30% costs) |
|---|---|---|---|---|
| Studio / 1BR | $90–$140 | 55–62% | $18,000–$25,000 | $12,600–$17,500 |
| 2BR | $130–$200 | 58–65% | $25,000–$38,000 | $17,500–$26,600 |
| 3BR | $180–$260 | 58–65% | $35,000–$50,000 | $24,500–$35,000 |
| 4+BR / luxury historic | $260–$450+ | 55–65% | $50,000–$90,000+ | $35,000–$63,000+ |
Important context: these estimates use a 30% operating cost haircut covering cleaning, utilities, supplies, maintenance, platform fees, and insurance — but not management fees. If you use a professional manager (15–25% of gross revenue), adjust your net downward accordingly. Our guide to Airbnb property management fees breaks this math down in detail.
Suburban discount: properties in St. Peters, O’Fallon, and Wentzville should underwrite to 10–30% below the St. Charles City figures above, consistent with the submarket ADR and occupancy differentials in the table. A 3-bedroom in O’Fallon earning $35,000 gross is a reasonable expectation; a 3-bedroom on Main Street St. Charles earning $50,000 is equally reasonable.
Breaking Down Operating Costs
Understanding where revenue goes is critical to calculating true Airbnb income. Here is what St. Charles operators typically face:
Cleaning and turnover: $80–$200 per turnover for a 2-bedroom, $150–$300 for a 3–4 bedroom. Most managers pass cleaning costs through to guests as a separate line item on the listing. Cleaning represents roughly 8–12% of gross revenue.
Utilities: Missouri’s temperature extremes — humid summers above 90°F, sub-freezing winters — push both AC and heating bills. Plan $200–$450/month all-in (Ameren MO electric, Spire gas, water, internet, streaming) for a typical 2–4 bedroom STR. This represents roughly 4–6% of gross revenue.
Insurance: Standard landlord insurance in Missouri averages approximately $1,220/year. STR-specific insurance — which you need, because a standard homeowner’s policy will not cover short-term rental activity — averages $2,000–$3,500/year with $1M+ commercial general liability. Budget $1,500–$3,500 depending on property value and coverage level.
Platform fees: Airbnb’s host-only fee is 3% per booking. Vrbo charges 5% host commission plus a guest service fee. If you list on both platforms (56% of St. Charles hosts do), plan for a blended 3–5% in platform fees.
Property management: Full-service STR management fees in the St. Louis metro range from 15% to 30% of gross booking revenue. We published our own fee structure on our pricing page because most operators in this market do not disclose their rates publicly. At 20–25% management plus 30% operating costs, managed properties retain roughly 45–55% of gross revenue as net cash flow to the owner.
Taxes: The St. Charles STR tax stack is material. In St. Charles City, most residential STR hosts pay approximately 12.95% in combined state, county, and city taxes on each booking — comprising the Missouri state sales tax (4.225%), St. Charles County general sales tax (1.725%), the county sleeping room tax (5%), and city sales tax (~2.0%). Properties that fall under City Code Chapter 620 (generally hotels with more than 8 rooms, not most residential STRs) pay additional city lodging taxes pushing the total to ~14.70%. Airbnb collects the state sales tax and the county sleeping room tax on the host’s behalf; the city taxes must be remitted separately. Vrbo does not collect the county sleeping room tax — Vrbo hosts must remit it themselves.
Typical expense breakdown as a percentage of gross revenue:
- Cleaning and turnover: 8–12%
- Utilities: 4–6%
- Maintenance and repairs: 4–8%
- Supplies (linens, toiletries, etc.): 2–3%
- Platform fees: 3–5%
- Insurance: 2–4%
- Property management (if applicable): 15–25%
Seasonal Income Patterns in St. Charles
AirDNA gives St. Charles a Seasonality score of 79 out of 100 — meaningful month-over-month variation, but better diversified than pure-leisure markets like Branson (which collapses 40+ occupancy points in January–February). Three overlapping demand streams prevent a deep winter trough: corporate travel, Ameristar Casino traffic, and the city’s signature Christmas Traditions event series.
Spring (March–May)
- Wedding season launches at Katy Trail wineries and Main Street venues (Old Stone Chapel, LaBelle Coeur)
- Lewis & Clark Heritage Days draws weekend visitors
- Corporate and relocation travel picks up with the spring hiring cycle
- Occupancy: 60–68%
- Expected monthly revenue: $2,400–$3,500 (2BR)
Summer (June–August)
- Peak family tourism season
- Festival of the Little Hills draws 300,000–350,000 visitors over three days in August — the single largest annual event in the metro
- Ameristar Casino summer concert series
- Katy Trail cycling and Augusta AVA wine-country tourism at peak
- Occupancy: 63–72%
- Expected monthly revenue: $2,800–$4,000 (2BR)
Fall (September–November)
- Oktoberfest at Frontier Park and Legends & Lanterns drive October bookings
- Fall foliage along the Katy Trail and wine-country harvest events
- Cardinals postseason can spike short-notice demand from out-of-town fans (St. Charles is 23 miles from downtown St. Louis)
- Occupancy: 60–70%
- Expected monthly revenue: $2,500–$3,600 (2BR)
Winter (December–February)
- Christmas Traditions on Main Street runs every Friday, Saturday, and Sunday from the day after Thanksgiving through Christmas Eve — the city’s signature differentiator versus every other St. Louis suburb
- Ameristar Casino provides year-round baseline traffic
- Corporate travel slows but does not stop — GM Wentzville, Citi, and Mastercard maintain operations through winter
- January–February is the trough, but occupancy holds above pure-leisure-market collapse
- Occupancy: 48–58%
- Expected monthly revenue: $1,800–$2,600 (2BR)
Annual variation: unlike Branson, where the post-New Year valley can cut revenue to single-digit occupancy, St. Charles maintains a floor driven by corporate demand and year-round casino traffic. Budget conservatively for January–February, but expect the trough to be shallower than in seasonal-dependent markets.
Owners who would rather lean into that corporate floor than ride out the trough can run the slow months as 30-day-minimum furnished stays instead of nightly ones. That is the model behind our corporate housing for O’Fallon and Wentzville assignments, which offers furnished homes here in the city for visiting teams on assignment at the Mastercard Tech Hub twelve miles west in O’Fallon or GM’s Wentzville Assembly plant about thirty minutes out I-70.
What Drives Airbnb Income in St. Charles
Not all properties in the metro perform equally. These factors separate the top quartile from the average:
Location Within the Metro
- Main Street walking distance: properties within a 5-minute walk of Main Street St. Charles command the 20–25% ADR premium reflected in the submarket table. This is the single strongest pricing lever in the market.
- Ameristar proximity: the casino resort draws 5.5 million visitors annually. Properties that can position themselves as the “Main Street alternative” to the Ameristar hotel capture overflow and groups who want a full kitchen and more space.
- Wine-country adjacency: properties near the Augusta AVA (America’s first officially designated wine region, predating Napa Valley by 8 months) benefit from April–October weekend demand, especially from bachelorette and anniversary-trip bookings.
- Corporate corridor: St. Peters and O’Fallon properties near Citi, Mastercard, and the I-70/I-64 interchange capture midweek corporate stays that offset lower weekend demand.
Property Features
- Full kitchen and living space: entire-home rentals (89% of the St. Charles market) significantly outperform private rooms
- Modern finishes with historic character: renovated Main Street properties that combine period architecture with updated interiors command the highest ADRs
- Outdoor space: patios, decks, and fire pits perform well in the extended Missouri warm season (April–October)
- Workspace: a dedicated desk and strong WiFi appeal to the corporate-travel segment, particularly in the St. Peters and O’Fallon submarkets
Management Quality
- Dynamic pricing: adjusting nightly rates to match demand events — Festival of the Little Hills, Christmas Traditions weekends, Cardinals home games, Ameristar concert weekends — can increase annual revenue 8–15% over flat pricing
- Review velocity: properties with 4.9+ ratings and recent reviews see measurably higher booking rates on both Airbnb and Vrbo
- Multi-platform distribution: 56% of St. Charles hosts list on both Airbnb and Vrbo. Listing on a single platform leaves demand on the table.
- Response speed: the St. Charles market has strong competition for guest attention. Quick communication — ideally under 1 hour — drives conversion from inquiry to booking
How Professional Management Affects Income
The management-fee question matters more in a supply-constrained market like St. Charles because the opportunity cost of underperformance is higher. If your property is one of only 48 permitted residential STRs in the city, every percentage point of lost occupancy or missed ADR optimization represents unrealized value from a scarce asset.
Self-Management Income
- Gross revenue: 100%
- Your time investment: 10–20 hours/week (guest communication, scheduling, cleaning coordination, maintenance)
- Operating costs: 15–20% of revenue
- Net income: roughly 80–85% of revenue
Self-management works well for owners who live in the metro, have flexible schedules, and enjoy the hospitality side of the business. The risk is underpricing — most self-managers leave 8–15% of potential revenue on the table through flat pricing and suboptimal listing optimization.
Professional Management Income
- Gross revenue: 100%
- Management fee: 15–25% of revenue (varies by operator; see our pricing page for published rates)
- Your time investment: 2–4 hours/month
- Operating costs included: cleaning, maintenance, and guest services coordinated by the manager
- Net income: roughly 55–65% of revenue after management fees and operating costs
The math works when professional management recovers more revenue (through dynamic pricing, multi-platform distribution, and optimized listings) than the fee costs. In a market with St. Charles’s seasonality profile, the management fee earns its keep primarily during the high-demand weekends — Christmas Traditions, Festival of the Little Hills, and Ameristar event weekends — when each incremental $20–$40 per night is being applied to the year’s highest occupancy base.
For a deeper comparison of the self-management vs. professional-management decision, see our income projection guide. And if you’d rather hand the dynamic pricing, multi-platform distribution, and compliance work to a local team, our St. Charles Airbnb management service is built for exactly this market.
The Regulatory Factor: Why Supply Constraint Matters for Income
St. Charles is not a market where supply and demand reach equilibrium naturally. The regulatory environment deliberately constrains new STR supply, which has direct implications for existing operators’ income stability.
City of St. Charles: 48-unit residential cap. Ordinance 22-104 (as amended April 15, 2025) limits residential-zone short-term rentals to 0.15% of total housing units — which works out to 48 permitted properties. As of May 2026, the City is at the cap and is not accepting new applications for residentially zoned STRs. Commercially zoned properties in the Extended Historic Preservation District are exempt from the cap and may still apply.
St. Charles County Ordinance 26-052. Unincorporated St. Charles County, which includes the wine-country and rural properties outside city limits, now has its own STR licensing law. Bill 5490 was introduced May 11, 2026, tabled May 26, and passed in substitute form on July 13, 2026. It became law on July 28 as Ordinance No. 26-052. It requires a county license ($25 application fee, $200 for two years), a 24/7 local contact, house rules, possible safety inspections, and lodging-tax compliance, with fines up to $500 per offense and each day counted as a separate offense. The adopted version dropped the proposed 600-foot buffer and occupancy caps, so it adds cost and paperwork rather than a supply cap. It has a six-month delayed operational date.
Adjacent municipalities. St. Peters, O’Fallon, Lake Saint Louis, and Wentzville do not currently have STR-specific ordinances. Properties in these cities operate under standard rental-occupancy permits, general business licenses, and zoning. This regulatory openness represents both opportunity (easier market entry) and risk (no cap means new supply can enter freely).
For the full jurisdiction-by-jurisdiction regulatory breakdown — including the Missouri state tax stack, county sleeping room tax, city license taxes, and HOA-layer considerations — see our St. Charles MO short-term rental regulations guide.
What this means for income: in a capped market, existing permit holders enjoy a structural moat. New demand flows into a fixed supply pool, supporting ADR and occupancy growth. The 3–5% year-over-year improvement in ADR and occupancy documented above is partly a consequence of this supply constraint — and it means income projections for current operators are more durable than in open-supply markets.
Real-World St. Charles Income Scenarios
Scenario 1: 2-Bedroom Condo Near Main Street
- Property value: $250,000
- ADR: $175 (walkable location, modern finishes)
- Occupancy: 62% (above market average due to location)
- Annual nights booked: 226
- Gross revenue: $39,550
- With management (22% fee + 8% other operating costs): $27,685 net
- Cap rate: 11.1%
Scenario 2: 3-Bedroom Home in St. Peters
- Property value: $320,000
- ADR: $195 (family-friendly, near Rec-Plex and corporate corridor)
- Occupancy: 64% (strong midweek corporate demand)
- Annual nights booked: 234
- Gross revenue: $45,630
- With management (22% fee + 8% other operating costs): $31,941 net
- Cap rate: 10.0%
Scenario 3: 4-Bedroom Historic Home on Main Street
- Property value: $475,000
- ADR: $320 (premium historic property, wedding-group target)
- Occupancy: 58% (larger groups, concentrated weekends)
- Annual nights booked: 212
- Gross revenue: $67,840
- With management (22% fee + 8% other operating costs): $47,488 net
- Cap rate: 10.0%
These scenarios assume current market conditions continue and use conservative operating-cost assumptions. Actual results depend on property condition, management quality, pricing strategy, and the regulatory environment’s evolution.
Comparing St. Charles to Other Markets
How does St. Charles stack up against the other metros where we manage properties?
| Metric | St. Charles, MO | Bentonville, AR | Branson, MO |
|---|---|---|---|
| Average ADR | $216.50 | $203 | $252 |
| Average occupancy | 61% | 57% | 47% |
| Annual revenue/listing | $30,100 | ~$28,000 | ~$30,500 |
| RevPAR | $120.60 | ~$105 | ~$108 |
| Primary demand driver | Historic district + casino + corporate | Walmart corporate + Crystal Bridges | Tourism + shows + outdoor |
| Seasonality risk | Moderate (79/100) | Moderate | High (winter collapse) |
| Supply constraint | Hard cap (48 units) | None | None |
St. Charles’s combination of strong ADR, solid occupancy, moderate seasonality, and supply constraint makes it arguably the most favorable risk-adjusted STR market of the three. Branson has higher peak-season upside but carries significantly more winter risk; Bentonville has strong corporate-driven consistency but faces open-supply competition.
Frequently Asked Questions
How much does an Airbnb make in St. Charles, MO?
The average St. Charles City short-term rental earns approximately $30,100 per year in gross revenue, per AirDNA May 2026 data. A well-managed 2–3 bedroom property can realistically gross $25,000–$50,000 annually, with net income of $17,500–$35,000 after operating costs. Properties in the walkable historic Main Street corridor command a 20–25% ADR premium over the surrounding suburbs.
What is the average occupancy rate for vacation rentals in St. Charles?
St. Charles City averages 61% annual occupancy across 321 tracked listings. St. Peters runs slightly higher at 65% (stronger midweek corporate demand), while O’Fallon (56%) and Wentzville (58%) sit below the city average. Well-managed properties with dynamic pricing and strong reviews typically exceed their submarket average by 5–10 percentage points.
Is St. Charles a good market for Airbnb investment?
St. Charles scores 98/100 on AirDNA’s Market Score with Investability 91 and Revenue Growth 84. ADR is up 3% year over year, occupancy up 4%, and RevPAR up 6%. The combination of growing demand and deliberately constrained supply (the 48-unit residential cap) creates favorable conditions for existing and commercially-zoned operators.
Can I get a new short-term rental permit in St. Charles City?
As of May 2026, the City is at its 48-unit residential STR cap and is not accepting new applications for residentially zoned properties. Commercially zoned properties in the Extended Historic Preservation District may still apply. The adjacent communities — St. Peters, O’Fallon, Lake Saint Louis, and Wentzville — do not currently have STR-specific caps.
What taxes do Airbnb hosts pay in St. Charles?
Most residential STR hosts in St. Charles City pay approximately 12.95% in combined taxes: Missouri state sales tax (4.225%), county general sales tax (1.725%), county sleeping room tax (5%), and city sales tax (~2.0%). Properties subject to Chapter 620 city lodging taxes (generally hotels with 8+ rooms, not most residential STRs) pay additional levies pushing the total to ~14.70%. Airbnb collects the state sales tax and county sleeping room tax on the host’s behalf; city taxes must be remitted separately. For the full jurisdiction-by-jurisdiction breakdown, see our St. Charles STR regulations guide.
How much does it cost to manage an Airbnb in St. Charles?
Full-service management fees in the St. Louis metro range from 15% to 30% of gross revenue. Add roughly 30% for operating costs (cleaning, utilities, insurance, platform fees, supplies), and a managed property typically retains 45–55% of gross revenue as net cash flow. Our Airbnb management fee guide breaks down the full fee landscape with per-metro comparisons.
Disclosure
Weekender Management operates in St. Charles and the broader western St. Louis suburbs. This guide uses publicly available market data from AirDNA (MarketMinder, accessed May 2026), Airbtics, and primary regulatory sources. Revenue estimates are directional ranges anchored to market averages, not guarantees. AirDNA revenue percentile data (top 25%, bottom 25%) is paywalled; the figures above are blended estimates based on market averages and publicly visible listing performance. The tax and regulatory information reflects the state of the law as of May 2026 — verify current requirements with your local jurisdiction before operating.
Data sources: AirDNA MarketMinder (May 2026), Airbtics (September 2024 snapshot), City of St. Charles official STR page (stcharlescitymo.gov), St. Charles County Council agenda (sccmo.org), Missouri Division of Tourism FY2024 report, U.S. Census Bureau population estimates.
How Much Could Your Property Earn?
Get a free, instant estimate of your vacation rental income potential. No obligation, no waiting.
Powered by real market data from Airbtics, a trusted short-term rental analytics platform.
Property Address
Enter your property address to get started